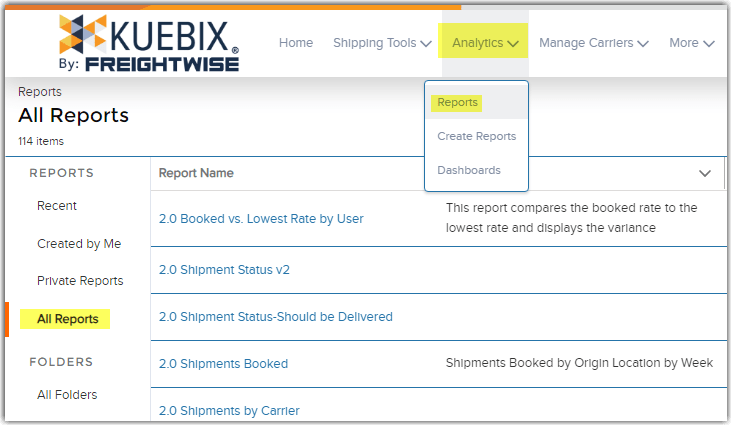
There are a number of premade reports available, accessed by clicking on the Analytics menu at the top of your screen.
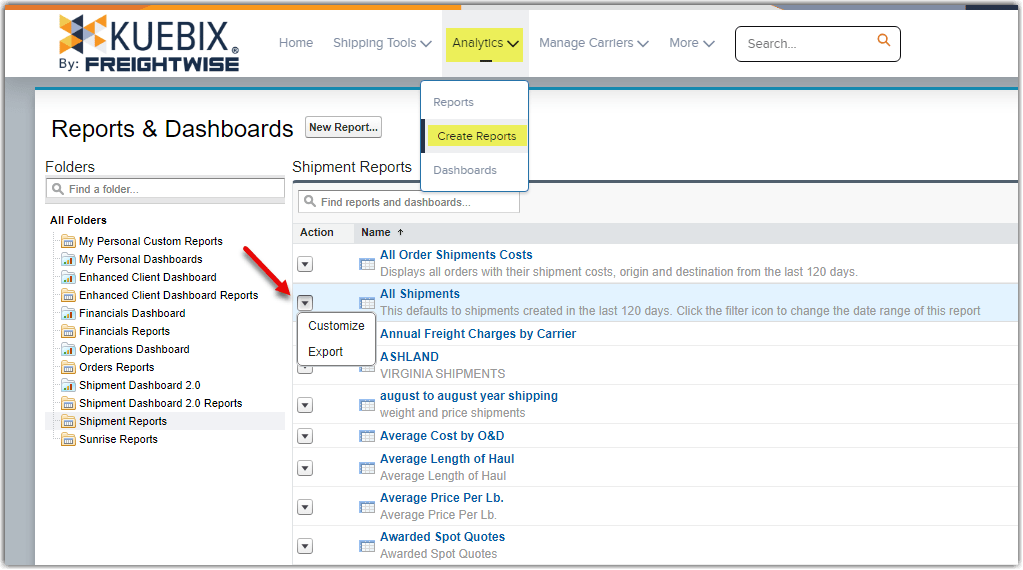
If you want to adjust or customize an existing report, you can select the Create Reports option, navigate to the report you’d like to adjust, then click on the upside down triangle to reveal the options and select Customize.
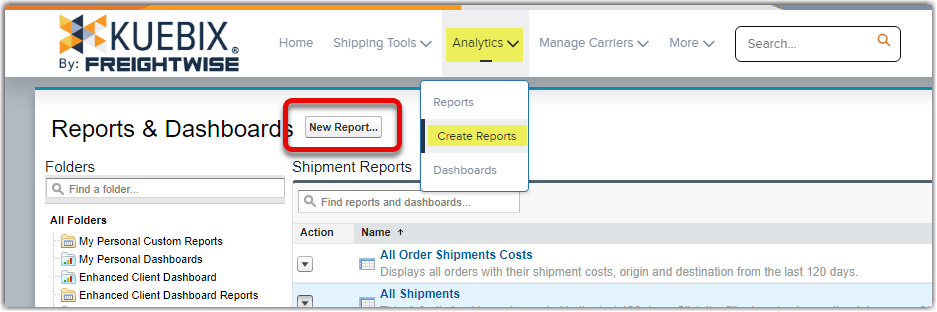
Or you can create your own report by hovering over Analytics, clicking on Create Reports, and then clicking on the New Report… button.
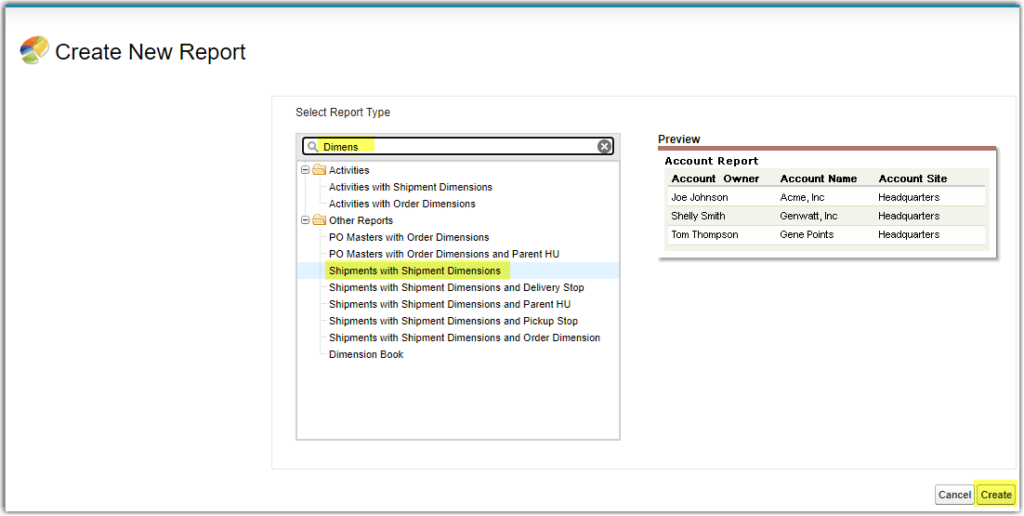
Different report types pull information from different records: as an example, the dimensions are stored on the Shipment Dimensions record, while the Class is stored on the Shipment Line Item record.
You can narrow down the results by typing in the search field.
Select your desired report from the results and click Create.
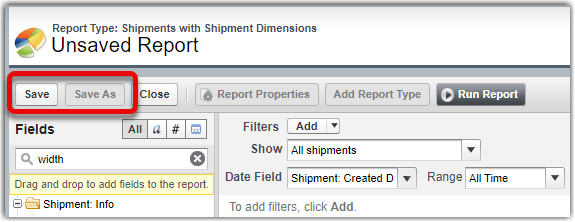
The Report Type at the top of the page shows the name of the report you’ve selected. The folders in the Fields area on the left show the information available for any associated records that can be added to the selected report type.
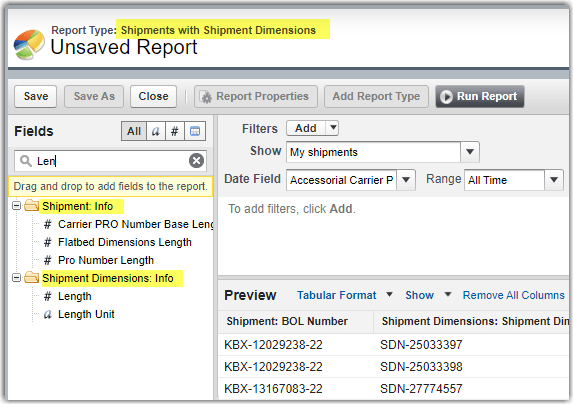
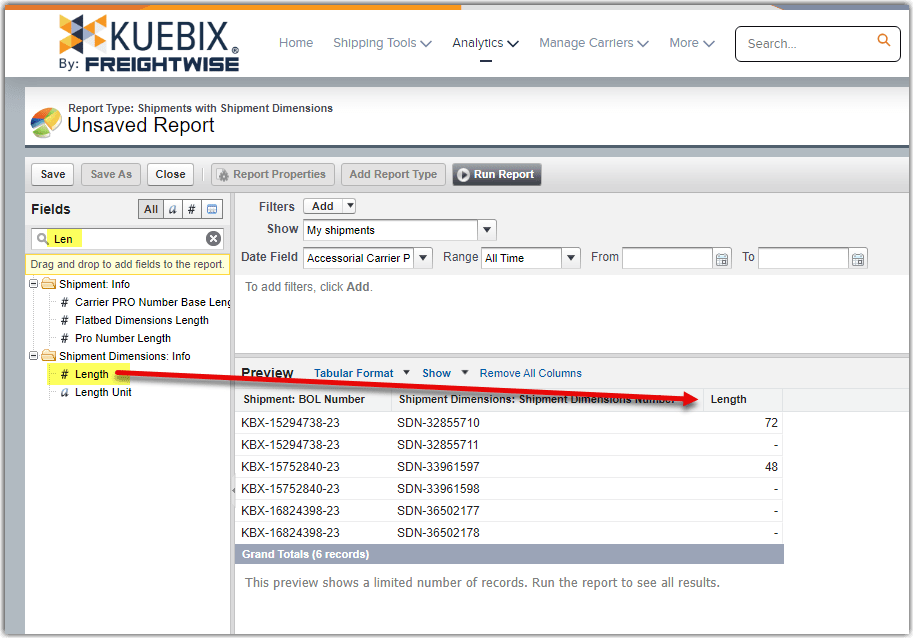
To add fields to your report, either double click on the name in the left fields list, or click and drag the name to the desired location.
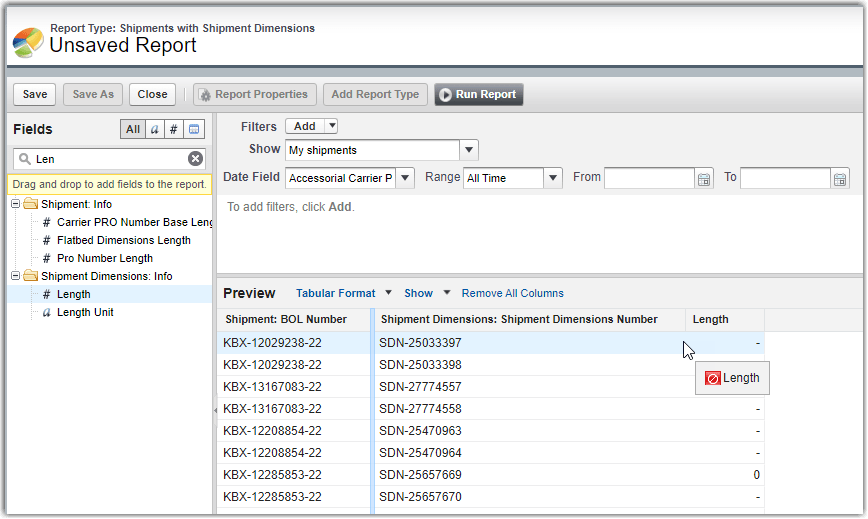
If a field has already been added to the report, it will not allow you to add it again, indicated by the red icon.
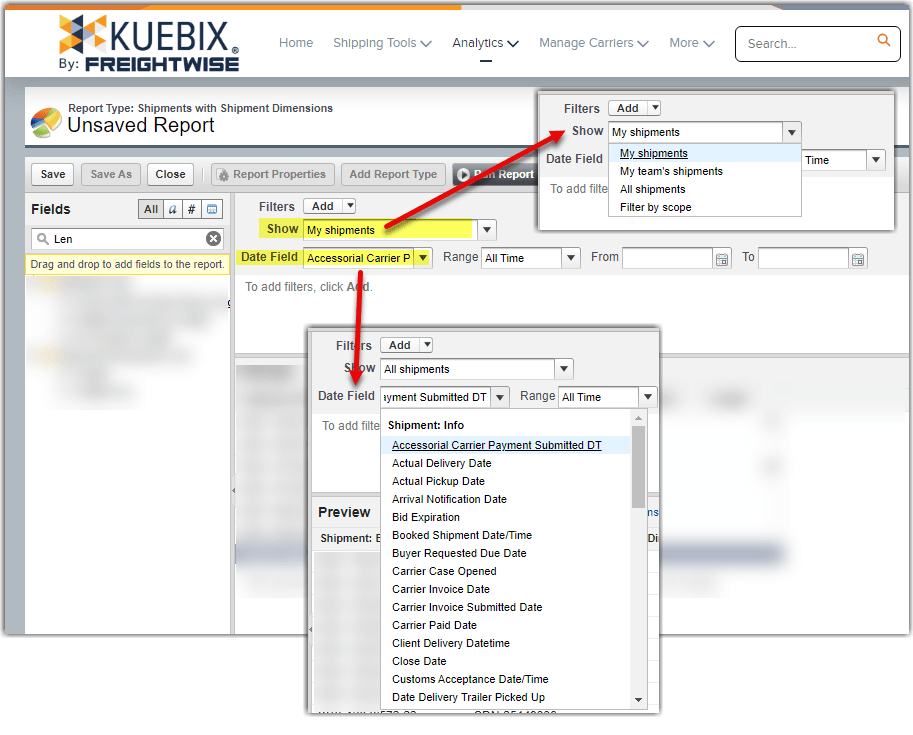
Please make sure to check the Show and Date Fields, as these will directly affect the report results.
Once you have adjusted the report to your liking, you can Save it (if it’s an entirely new report) or click Save As (if you’re customizing an existing report).
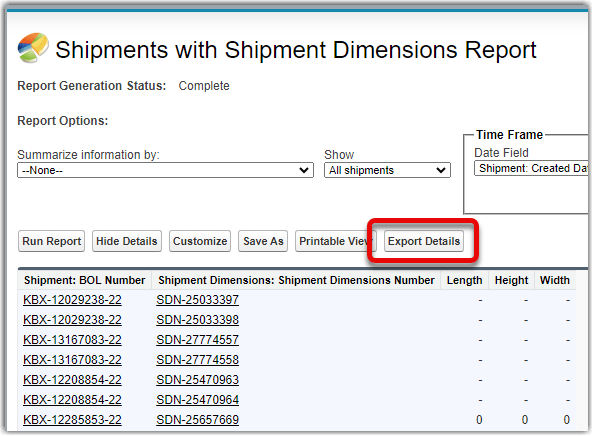
To see all results in your report, click the Run Report button. Depending on the amount of data you’ve requested, it may take a minute or two to display the results.
The report can now be exported as either a csv or an xls document, using the Export Details button.
If you need a report that will most likely result in more than 1k results, we recommend dividing the report into increments – e.g. January through March, April through June, etc. and then compiling the reports in a spreadsheet on your computer.
